2011 MS Dept. of Education School District Accountability Assessment Maps, Tables and Charts
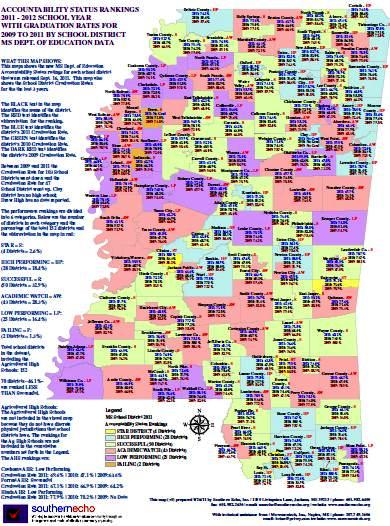
- Map – 2011 – MS Dept. of Education Accountability Ranking, with Quality Distribution Index score and Graduation Rate Percentage for each valium online buy school district
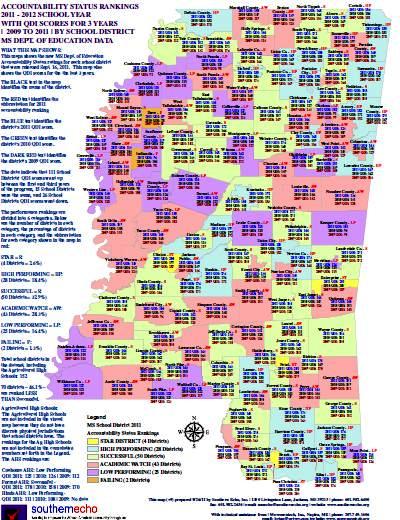
- Map – 2009-2011 – MS Dept. of Education Quality Distribution Index scores for 2009 through 2011 for each buy ambien school district, with 2011 Accountability Ranking
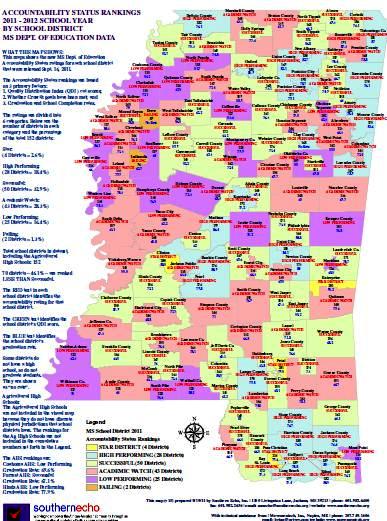
- Map – 2009-2011 – Graduation Rate Percentages for each school district for 2009 through 2011, with 2011 Accountability Ranking
- Table – 2011 – MS Dept. of Education accountability assessment data for all school districts and schools released September 16, 2011
2010 MS Dept. of Education School District Accountability Assessment Maps, Tables and Charts
 |
Map – 2011 – MS Dept. of Education Accountability Ranking, with Quality Distribution Index score and Graduation Rate Percentage for each school district This map shows for each school district the 2011 Accountability Ranking, the Quality Distribution Index (QDI) score, and the Graduation Rate percentage. |
 |
Map – 2009-2011 – MS Dept. of Education Quality Distribution Index scores for 2009 through 2011 for each school district, with 2011 Accountability Ranking This map shows for each school district the Quality Distribution Index (QDI) scores for 2009, 2010 and 2011 to enable the reader to assess the degree of progress for each school district during the past 3 years. The map also shows for each school district the 2011 Accountability Ranking. |
 |
Map – 2009-2011 – Graduation Rate Percentages for each school district for 2009 through 2011, with 2011 Accountability Ranking This map shows for each school district the Graduation Rate Percentages for 2009, 2010, and 2011 to enable the reader to assess the degree of progress for each school district during the past 3 years. The map also shows for each school district the 2011 Accountability Ranking. |
 |
Table – 2011 – MS Dept. of Education accountability assessment data for all school districts and schools released September 16, 2011 This table provides all of the MS Dept. of Education accountability assessment data approved by the State Board of Education Sept. 16, 2011. The data is derived from the student performance on standardized tests during the 2010-2011 school year and from other data reported by each school district. The data includes district and school accountability ranking, QDI scores, graduation rates, whether growth met, HSCI scores, whether Average Yearly Progress met, and Title I Improvement Status. |

