Maps
Our maps were created using software granted by ESRI. To learn more about how we create our maps click here.
- District Accountability Status Map
- District Quality Distribution Index (QDI) Scores
- District Graduation Rates
- District Growth Goals
- District Percent Students At-Risk (Poverty Rate)
- District Percent Black Students
Map Descriptions
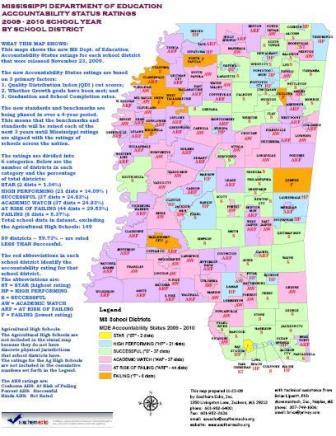 |
District Accountability Status Map
This map shows the 2009-2010 Accountability Status assigned each MS school district. |
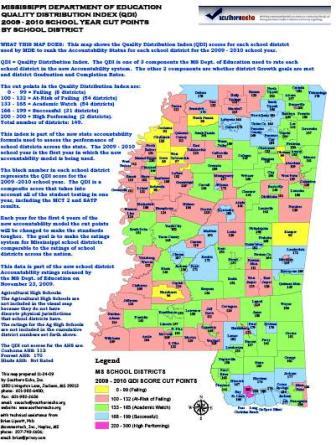 |
District QDI Scores
This map shows the Quality Distribution Index (QDI) score assigned each MS school district, based on 3 factors: all student tests in 2008-2009, whether growth goals met, and graduation and completion rates. This buy ativan from india data is shown together with the 2009-2010 Accountability Status for each district. |
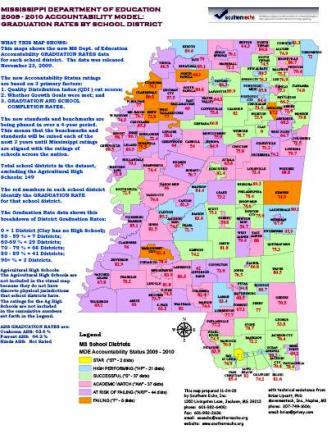 |
District Graduation Rates
This map shows the Graduation rate achieved by each school district in the prior year based on a multi-year cohort. The Graduation rate impacts the QDI score. This buy ambien no prescription data is shown together with the 2009-2010 Accountability Status for each district. |
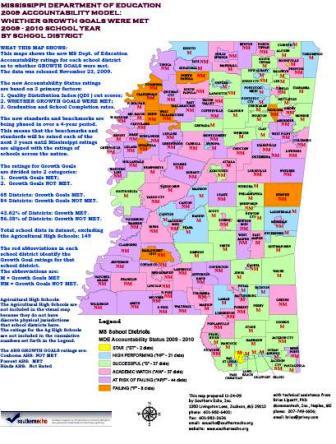 |
District Growth Goals
This map shows whether or not each district met Growth Goals set for the district. Whether Growth goals have been met impacts the QDI score. This data is shown together with the 209-2010 Accountability Status for each district. |
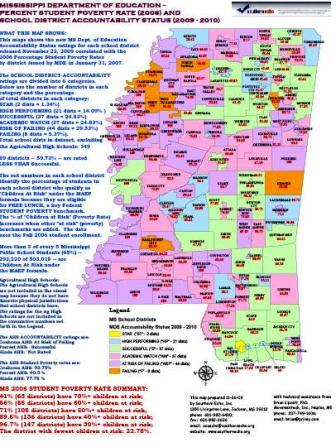 |
District Percent Students At-Risk (Poverty Rate)
This map shows the percentage of Students At-Risk (Poverty Rate based on eligibility for Free Lunch) in each school district based on 2006 enrollment data. This data is shown together with the 2009-2010 Accountability Status for each district. |
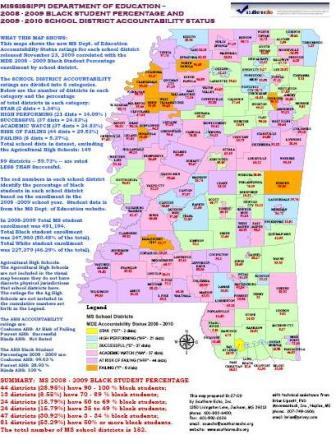 |
District Percent Black Students
This map shows the Percentage of Black Students in each school district based on 2008-2009 enrollment data. This data is shown together with the 2009-2010 Accountability Status for each district. |