2012 MS Dept. of Education School District Accountability Assessment Maps, Tables and Charts
- Map – Accountability Status Ranking
- Map – Quality Distribution Index Scores with Accountability Status Rankings
- Map – Graduation Rate Percentages with Accountability Status
- Map – Growth Status Rankings with Accountability Status
- Map – Schools in Year 1 and Year 2 of Improvement Status
- Map – High School Math Proficiency with Accountability Status
- Map – High School Reading Proficiency with Accountability Status
- Map – 8th Grade Math Proficiency with Accountability Status
- Map – 8th Grade Reading Proficiency with Accountability Status
- Map – 4th Grade Math Proficiency with Accountability Status
- Map – 4th Grade Reading Proficiency with Accountability Status
2012 MS Dept. of Education School District Accountability Assessment Maps, Tables and Charts
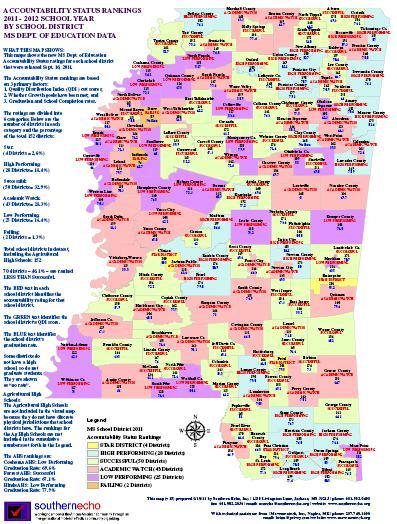 |
Map – Accountability Status Ranking This map shows the new MS Dept. of Education Accountability Status ratings for each school district that were released Sept. 16, 2011. |
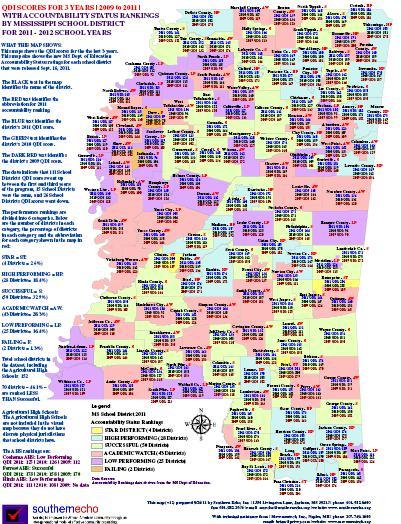 |
Map – Quality Distribution Index Scores with Accountability Status Rankings This map shows the QDI scores for the last 3 years. This map also shows the new MS Dept. of Education Accountability Status ratings for each school district that were released Sept. 16, 2011. |
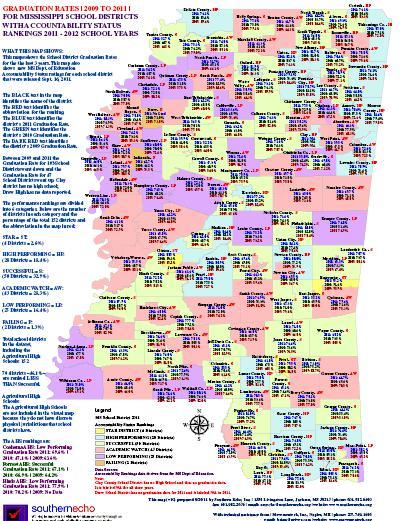 |
Map – Graduation Rate Percentages with Accountability Status This map shows the School District Graduation Rates for the last 3 years. This map also shows new MS Dept. of Education Accountability Status ratings for each school district that were released Sept. 16, 2011. |
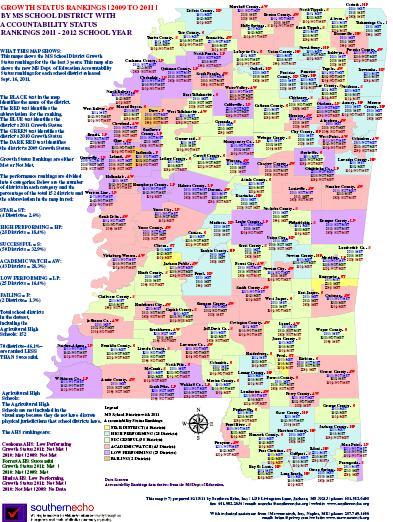 |
Map – Growth Status Rankings with Accountability Status This map shows the MS School District Growth Status rankings for the last 3 years. This map also shows the new MS Dept. of Education Accountability Status rankings for each school district released Sept. 16, 2011. |
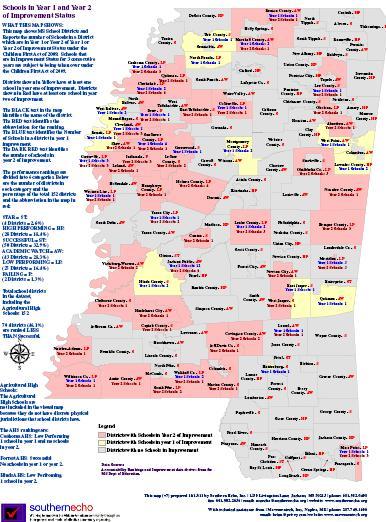 |
Map – Schools in Year 1 and Year 2 of Improvement Status This map shows MS School Districts and reports the number of schools in a district which are in Year 1 or Year 2 of Improvement Status under the Children First Act of 2009. Schools that are in Improvement Status for 3 consecutive years are subject to being taken over under the Children First Act of 2009. |
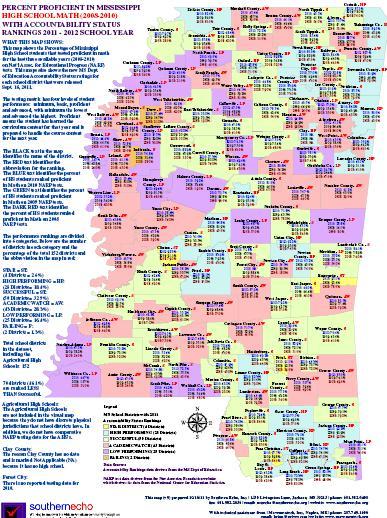 |
Map – High School Math Proficiency with Accountability Status This map shows the percentage of Mississippi high school students that buy generic tramadol online tested proficient in math for the last three available years (2008-2010) on Nat’l Assoc. for Educational Progress (NAEP) tests. This map also shows the new MS Dept. of Education Accountability Status rankings for each school district that were released Sept. 16, 2011. |
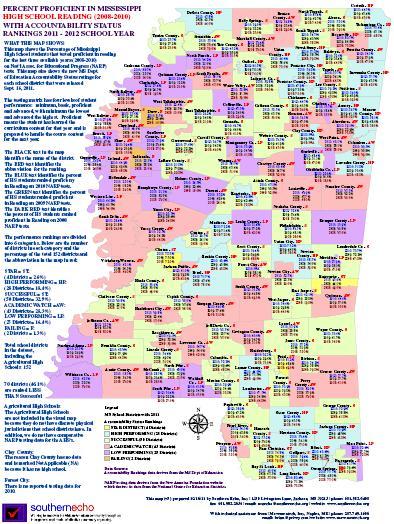 |
Map – High School Reading Proficiency with Accountability Status This map shows the percentage of Mississippi high school students that tested proficient in reading for the last three available years (2008-2010) on Nat’l Assoc. for Educational Progress (NAEP) tests. This map also shows the new MS Dept. of Education Accountability Status rankings for each school district that were released Sept. 16, 2011. |
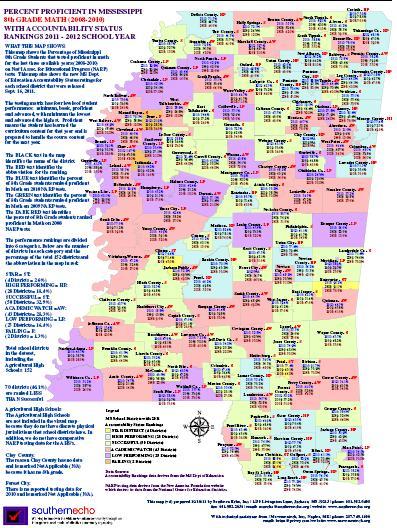 |
Map – 8th Grade Math Proficiency with Accountability Status This map shows the percentage of Mississippi 8th grade students that tested proficient in math for the last three available years (2008-2010) on Nat’l Assoc. for Educational Progress (NAEP) tests. This map also shows the new MS Dept. of Education Accountability Status rankings for each school district that were released Sept. 16, 2011. |
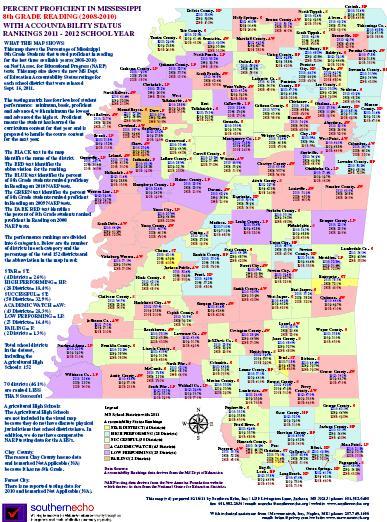 |
Map – 8th Grade Reading Proficiency with Accountability Status This map shows the percentage of Mississippi 8th grade students that tested proficient in reading for the last three available years (2008-2010) on Nat’l Assoc. for Educational Progress (NAEP) tests. This map also shows the new MS Dept. of Education Accountability Status rankings for each school district that were released Sept. 16, 2011. |
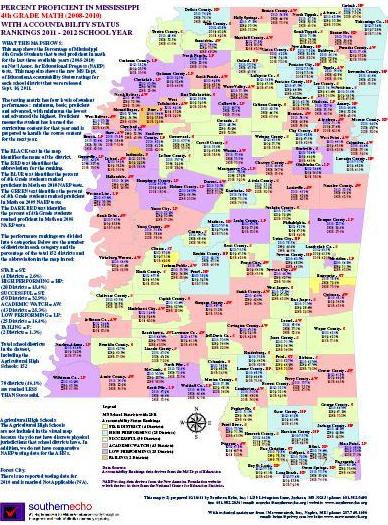 |
Map – 4th Grade Math Proficiency with Accountability Status This map shows the percentage of Mississippi 4th grade students that tested proficient in math for the last three available years (2008-2010) on Nat’l Assoc. for Educational Progress (NAEP) tests. This map also shows the new MS Dept. of Education Accountability Status rankings for each school district that were released Sept. 16, 2011. |
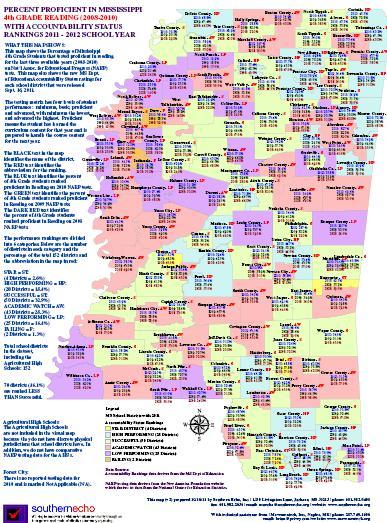 |
Map – 4th Grade Reading Proficiency with Accountability Status This map shows the percentage of Mississippi 4th grade students that tested proficient in reading for the last three available years (2008-2010) on Nat’l Assoc. for Educational Progress (NAEP) tests. This map also shows the new MS Dept. of Education Accountability Status rankings for each school district that were released Sept. 16, 2011. |