Charts

  1. HS Graduation rates by race – US, MS
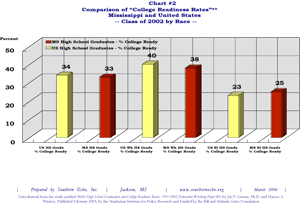
  2. “College ready” graduation rates by race – US, MS
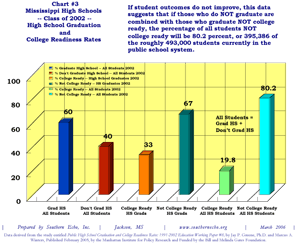
  3. HS graduation and “college ready” graduation rates – MS all
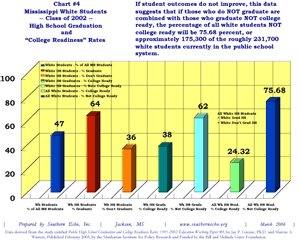
  4. HS graduation and “college ready” graduation rates – MS white
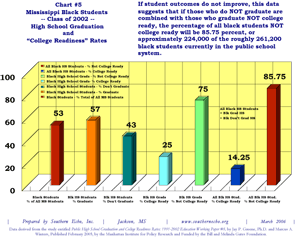
  5. HS graduation and “college ready” graduation rates – MS black
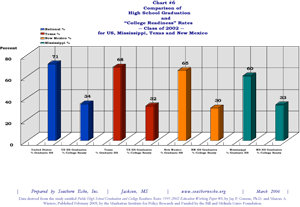
  6. HS graduation and “college ready” graduation rates – MS, TX, NM
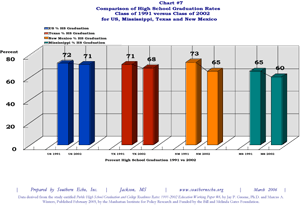
  7. HS graduation rates – US, MS, TX, NM – ‘91 vs ‘02
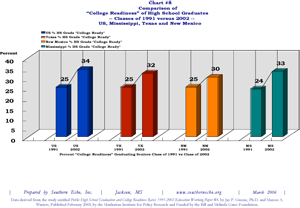
  8. “College ready” graduation rates – US, MS, TX, NM – 1991 vs 2002
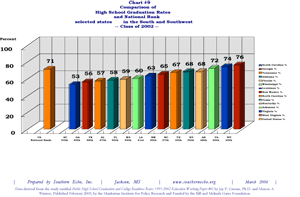
  9. HS graduation rates – selected south and southwest states
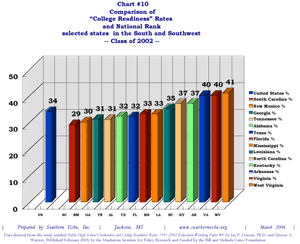
  10. “College ready” graduation rates – selected south and southwest states
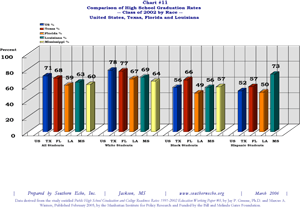
  11. HS graduation rates by race – US, MS, TX, FL, LA
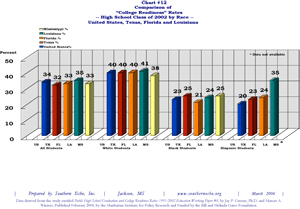
  12. “College ready” graduation rates by race – US, MS, TX, FL, LA
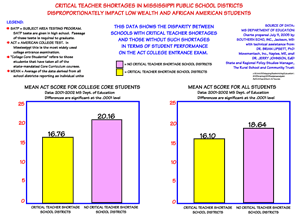
  13. Critical teach shortages impact student performance on college entrance exams
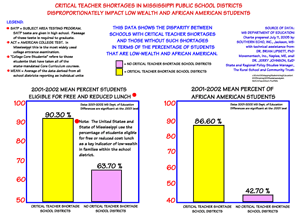
  14. Black Students and Low-wealth Students more likely to have unqualified teachers

These 12 charts reveal the distressing state of high school graduation rates and high school graduation rates for students who are college ready in the US, Mississippi and other states in the south and southwest regions.

These charts were prepared by Southern Echo, Inc., Jackson, MS, March 2006, with data derived from a study entitled Public High School Graduation and College Readiness Rates: 1991-2002 Education Working Paper #8, by Jay P. Greene, Ph.D. and Marcus A. Winters, Published February 2005, by the Manhattan Institute for Policy Research and Funded by the Bill and Melinda Gates Foundation.

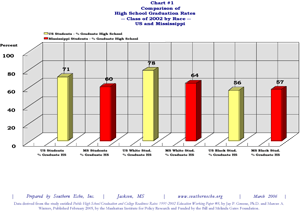
Chart #1: HS Graduation rates by race – US, MS
>Chart #2: “College ready” graduation rates by race – US, MS
Chart #3: HS graduation and “college ready” graduation rates – MS all
Chart #4: HS graduation and “college ready” graduation rates – MS white
Chart #5: HS graduation and “college ready” graduation rates – MS black
Chart # 6: HS graduation and “college ready” graduation rates – MS, TX, NM
Chart #7: HS graduation rates – US, MS, TX, NM – ‘91 vs ‘02
Chart #8: “College ready” graduation rates – US, MS, TX, NM – 1991 vs 2002
Chart #9: HS graduation rates – selected south and southwest states
Chart #10: “College ready” graduation rates – selected south and southwest states
Chart #11: HS graduation rates by race – US, MS, TX, FL, LA
Chart #12: “College ready” graduation rates by race – US, MS, TX, FL, LA
Chart #13: Critical teach shortages impact student performance on college entrance exams This chart shows the difference in performance on college entrance exams for students who attend a “critical teacher shortage school” and those who do not. The disparity is striking and demonstrates the impact and resulting unfair disparity when qualified teachers are not provided in the classroom.
Chart #14: Black Students and Low-wealth Students more likely to have unqualified teachers This chart shows that low-wealth students and African American students, by substantial margins, are more likely to have unqualified teachers in their classrooms when compared to students who are white or whose family incomes are above the poverty line. This disparity is a nationwide phenomenon.

1350 Livingston Ln., Jackson, MS, 39213

(601) 982-6400

Southern Echo © All rights reserved