- MS Adequate Education Fund Underfunded 2011-2013
- MS Adequate Education Fund Underfunded in Fiscal Year 2013 with 2011-2012 Accountability Status Rankings
- MS School Dist. Corporal Punishment Incidents 2009-2010 to 2010-2011
- 65% of Mississippi Public School Students are at-risk
- Mississippi Public Schools – Highest Graduation Rates and Highest Dropout Rates
- Mississippi Student Graduation Rate Estimates by School District
- 2007 Mississippi School Districts with Level 1 PRIORITY schools
- 2007 Mississippi School Districts with Level 2 UNDERPERFORMING Schools
- 2005-2006 Suspension and Expulsion Totals by Mississippi School Districts
- Critical teacher shortages in Mississippi School Districts – 2005
- Percent Rates of Poverty in Mississippi School Districts – 2001-2002
- Black Student Percentage in Mississippi School Districts – 2003-2004
- Percent Persons at or Below Poverty Level – Southeast and Southwest Counties
- Impact of Governor’s 2% reduction in MAEP funds – fiscal year 2009
- Impact of Governor’s 4% reduction in MAEP funds – fiscal year 2010
Map Descriptions
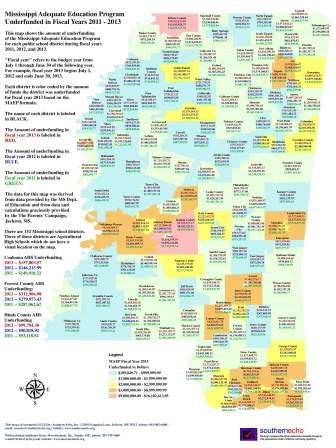 |
MS Adequate Education Fund Underfunded 2011-2013
This map illustrates for each MS school district the level of UNDERFUNDING of the MS Adequate Education Program (MAEP) by the MS Legislature and Governor for the last three fiscal years, 2011, 2012 and 2013. |
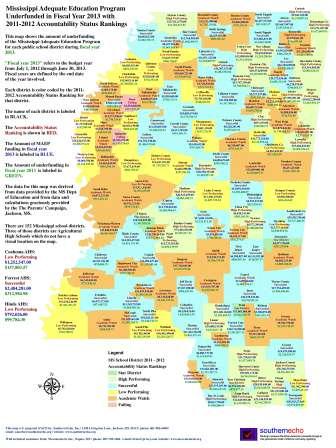 |
MS Adequate Education Fund Underfunded in Fiscal Year 2013 with 2011-2012 Accountability Status Rankings
This map illustrates for each MS school district the Accountability Status Rankings for each district, the fiscal year 2013 MAEP funding level, and the amount by which MAEP has been underfunded in each school district for fiscal year 2013. FY 2013 runs from July 1, 2012 through June 30, 2013. |
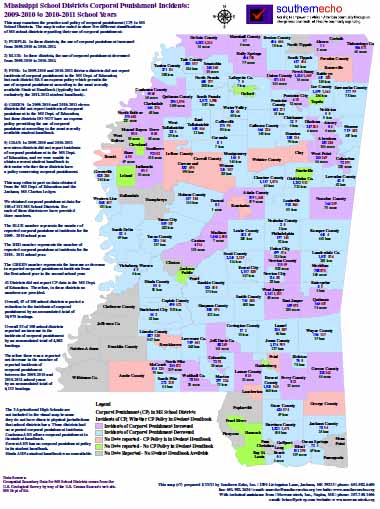 |
MS School Dist. Corporal Punishment Incidents 2009-2010 to 2010-2011
This map illustrates the changes by school district from the 2009-2010 school year to the 2010-2011 school year in the use of corporal punishment – i.e. the number of occasions on which teachers or administrators beat students with a hard instrument. For each district that provided data to the MS Dept. of Education we have color-coded the data for 09-10 and 10-11 on the map. We have also shown on the map the difference in the number of student beatings from 09-10 to 10-11. Overall 67 districts reported a decrease in the number of student beatings from 09-10 to 10-11. Overall 33 districts reported an increase in the number of student beatings from 09-10 to 10-11. |
 |
65% of Mississippi Public School Students are at-risk
This map shows the percentage of students in each school district that qualify as “children at risk” under the MAEP formula because they are eligible for free lunch. 293,220 of 503,018 are “children at risk”. Data based on Fall 2006 student enrollment. |
 |
Mississippi Public Schools – Highest Graduation Rates and Highest Dropout Rates
This map tracks a four-year cohort of students who began 9th grade in the school year 2001-2002. This data released in 2007 shows those school districts with the highest graduation rates and those with highest dropout rates. |
 |
Mississippi Student Graduation Rate Estimates by School District
This map provides high school graduation rate estimates by school district based on MS Dept. of Education data released in 2007 for a 4-year buy zolpidem online pharmacy cohort of students who began 9th grade in the 2001-2002 school year. The statewide rate was 61.1 percent. In CantonMunicipal only 27.3 percent graduated. |
 |
2007 Mississippi School Districts with Level 1 PRIORITY schools
This map shows how many schools have been designated “priority”, the lowest possible ranking, within districts that have priority schools. The data is based on the designation of accountability levels by the MS Dept. of Education in 2007. The designation “priority” is based on student performance on state standardized tests. |
 |
2007 Mississippi School Districts with Level 2 UNDERPERFORMING Schools
This map shows how many schools have been designated “underperforming” within districts that have underperforming schools. The data is based on the designation of accountability levels by the MS Dept. of Education in 2007. The designation “underperforming” is based on student performance on state standardized tests. |
 |
2005-2006 Suspension and Expulsion Totals by Mississippi School Districts
According to MS Dept. of Education data, the 152 Mississippi school districts self-reported that 79,042 students were suspended during the 05-06 school year, and 756 students were expelled. That is a lot of lost education time for students. See the maps and charts that illustrate graduation, college-readiness and dropout rates. |
 |
Critical teacher shortages in Mississippi School Districts – 2005
Critical teacher shortages are disproportionately concentrated in public school districts with high percentages of black students and in public school districts with high percentages of low-wealth students. Districts with critical teacher shortages correlate with districts in which students are lowest-performing. To learn students need qualified, certified teachers in the classroom. |
 |
Percent Rates of Poverty in Mississippi School Districts – 2001-2002
This map shows the percentage of students in each school district that qualify for free lunch under the US Dept. of Agriculture guidelines. This benchmark is used by the state to determine which students fall below the poverty line and to calculate district-wide poverty rates. |
 |
Black Student Percentage in Mississippi School Districts – 2003-2004
This map illustrates the percentage of black students in each school district in Mississippi. Statewide black students comprise approximately 53 percent of the students attending public schools. The concentration of black students in certain school districts, especially in the Delta, correlates with the low-wealth and critical teacher shortage school districts. |
 |
Percent Persons at or Below Poverty Level – Southeast and Southwest Counties
This map uses 2000 census Block Group level data to illustrate the concentration of poverty in some of the counties of the southeastern and southwestern states. |
 |
Impact of Governor’s 2% reduction in MAEP funds – fiscal year 2009
This map shows how much money each school district would lose this year, fiscal year 2009, if the Governor were to cut two percent from the MAEP appropriation made by the 2008 legislature. |
 |
Impact of Governor’s 4% reduction in MAEP funds – fiscal year 2010
This map shows how much money each school district would lose next year, fiscal year 2010, if the Governor were to cut four percent from the MAEP appropriation. |