2010 MS Dept. of Education School District Accountability Assessment Maps, Tables and Charts
- Table – 2010 Comparison of Year 1 and Year 2 of MS Dept. of Education Accountability Assessment Data
- Map – 2010 MS Dept. of Education Quality Distribution Index Rankings for each school district
- Map – 2010 MS Dept. of Education Quality Distribution Index Scores for each school district
- Map – Comparison of MS Dept. of Education QDI Scores for Accountability Assessment Year 1 and Year 2
- Map – 2010 MS Dept. of Education Accountability Assessment Data as to whether each school district has Met Growth requirements or has Not Met Growth requirements in the 2009-2010 school year
- Map — 2010 – Graduation Rates for each school district
- Map — 2010 – Percent Black Students for each school district
- Map — 2010 – Percent Students At Risk (Eligible for Free Lunch) for each school district
- List – Critical Teacher Shortage School Districts for the 2008-2009 School Year
2010 MS Dept. of Education School District Accountability Assessment Maps, Tables and Charts
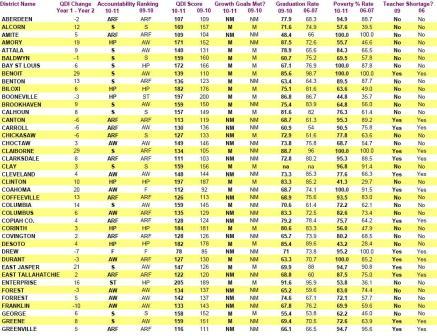 |
Table – 2010 Comparison of Year 1 and Year 2 of MS Dept. of Education Accountability Assessment Data This Table compares by school district the 1st assessment year data with the 2nd assessment year data for: a. QDI rankings, b. QDI scores, c. net gain or loss in QDI scores from assessment year one to assessment year two, d. whether growth met or not met, e. graduation rates, f. black student percentage and g. percent students eligible for free lunch (free lunch data compares 2010 with 2006). |
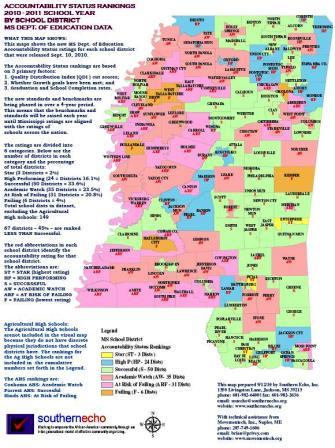 |
Map – 2010 MS Dept. of Education Quality Distribution Index Rankings for each school district This map shows the MS Dept. of Education QDI Accountability Assessment Rankings assigned to each school district for the 2010-2011 school year. The Quality Distribution Index (QDI) Ranking assigned to each MS school district is based on 3 factors: all student tests in 2009-2010, whether growth goals have been met, and graduation and completion rates. |
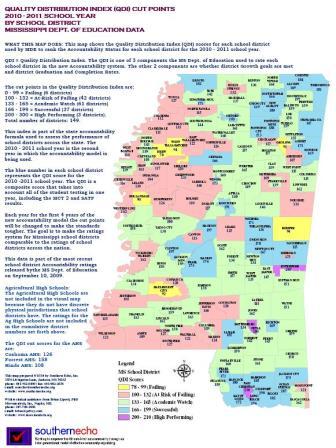 |
Map – 2010 MS Dept. of Education Quality Distribution Index Scores for each school district This map shows the MS Dept. of Education QDI Accountability Assessment Score assigned to each school district for the 2010-2011 school year. |
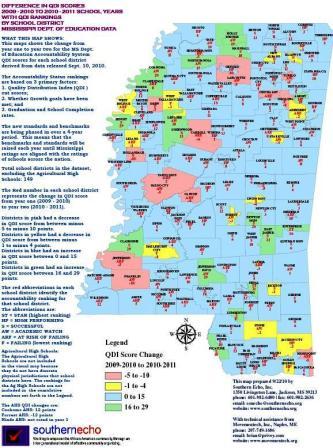 |
Map – Comparison of MS Dept. of Education QDI Scores for Accountability Assessment Year 1 and Year 2 This map compares the MS Dept. of Education QDI Scores for each school district for Accountability Assessment Year and Year 2, showing the extent of change in each district and the QDI Ranking for each district. |
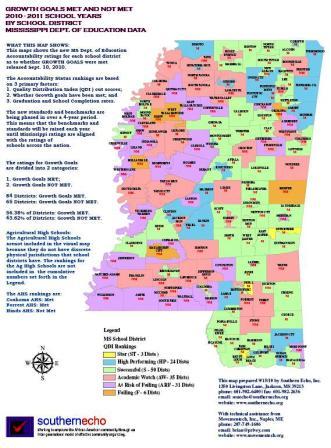 |
Map – 2010 MS Dept. of Education Accountability Assessment Data as to whether each school district has Met Growth requirements or has Not Met Growth requirements in the 2009-2010 school year This map shows whether or not in the 2009-2010 school year each district has met Growth Goals set for the district. Whether Growth goals have been met impacts the QDI Ranking. This data is shown together with the 2010-2011 Accountability Ranking for each school district. |
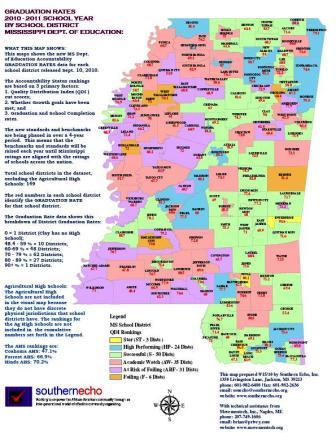 |
Map — 2010 – Graduation Rates for each school district This map shows the Graduation rate achieved by each school district in the prior year based on a multi-year cohort. The Graduation rate impacts the QDI score. This data is shown together with the 2010-2011 Accountability Ranking for each district. |
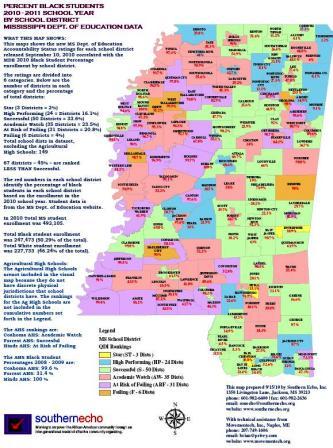 |
Map — 2010 – Percent Black Students for each school district This map shows the Percentage of Black Students in each school district based on 2009-2010 enrollment data. This data is shown together with the 2010-2011 Accountability Ranking for each district. |
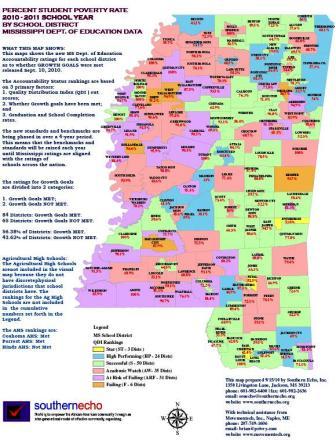 |
Map — 2010 – Percent Students At Risk (Eligible for Free Lunch) for each school district This map shows the percentage of Students At-Risk (Poverty Rate based on eligibility for Free Lunch) in each school district based on 2009-2010 enrollment data. This data is shown together with the 2010-2011 Accountability Ranking for each district. |
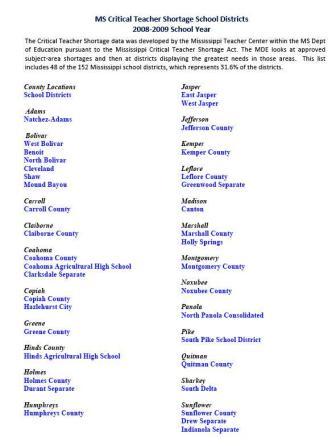 |
List – Critical Teacher Shortage School Districts for the 2008-2009 School Year This list identifies for the 2008-2009 School Year which MS school districts are classified as critical teacher school districts pursuant to the MS Critical Teacher Shortage Act, based on data provided by the MS Dept. of Education. |