- MS Census Partnership Specialists Map
- Mississippi Hard to Count Census Tracts
- Mississippi Hard to Count Census Block Groups
- Mississippi Congressional Districts 2009
- Biloxi-Gulfport, MS Hard to Count Census Tracts
- Bolivar, County, MS Hard to Count Block Groups
- Calhoun County, MS Hard to Count Block Groups
- Carroll County, MS Hard to Count Block Groups
- Clay County, MS Hard to Count Block Groups
- Grenada County, MS Hard to Count Block Groups
- Holmes County, MS Census Maps
- Humphreys County, MS Hard to Count Block Groups
- Issaquena County, MS Hard to Count Block Groups
- Jones County, MS Hard to Count Census Tracts
- Leflore County, MS Hard to Count Census Tracts
- Madison County, MS Hard to Count Census Tracts
- Montgomery County, MS Hard to Count Block Groups
- Sharkey County Hard to Count Block Groups
- Sunflower County Census Maps
- Tunica County, MS Hard to Count Census Tracts
- Washington County, MS Census Maps
- Webster County, MS Hard to Count Block Groups
Mississippi Census Map Descriptions
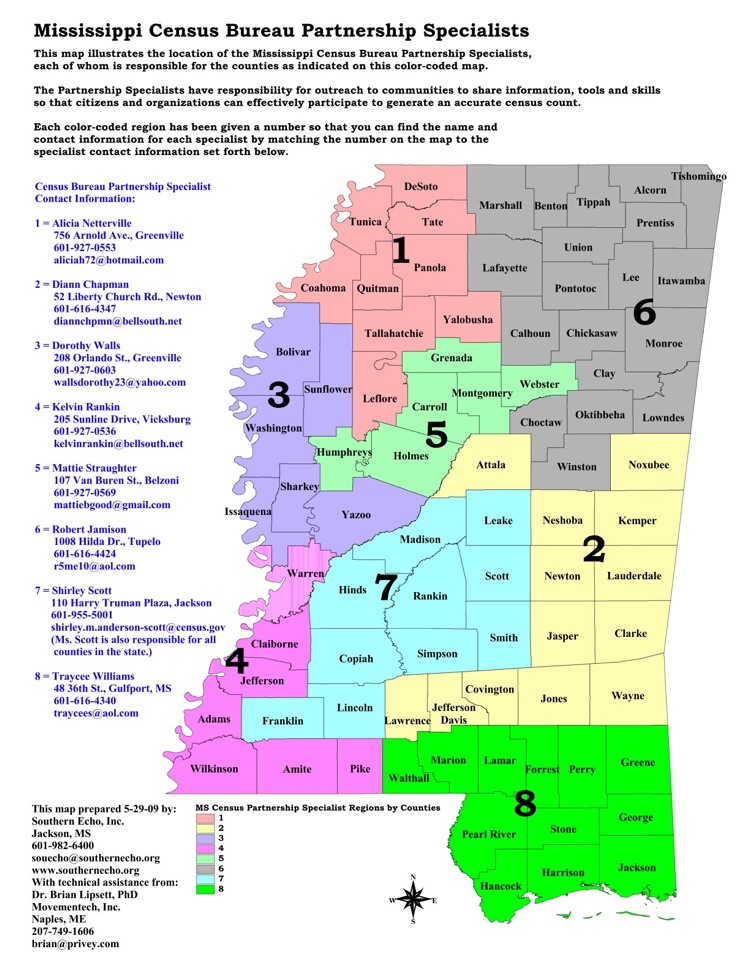 | Southern Echo’s Map of the Census Bureau’s Census Partnership Specialists in Mississippi This map illustrates the location of the Mississippi Census Bureau Partnership Specialists, each of whom is responsible for the counties as indicated on this color-coded map. The Partnership Specialists have responsibility for outreach to the communities to share information, tools and skills so that citizens and organizations can effectively participate to generate an accurate census count. Each color-coded region has been given a number so that you can find the name and contact information for each specialist by matching the number on the map to the appropriate specialist contact information. |
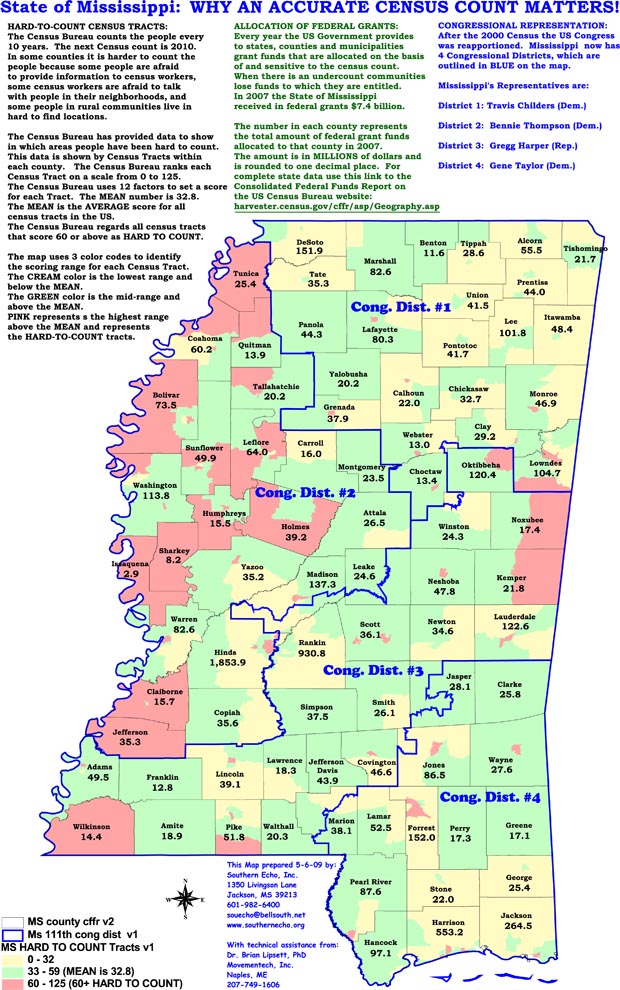 | Mississippi Hard to Count Census Tracts This Mississippi map shows the hard to count locations where it is more likely there will be a census undercount. An “undercount” means less federal grant funds for the city, county and state. The map also shows how many millions of dollars in federal grants each county received in 2007. |
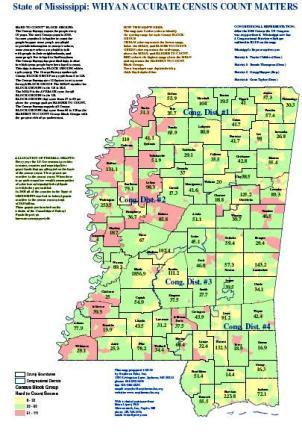 | Mississippi Hard to Count Census Block Groups This Mississippi state map shows the Hard To Count Census Block Groups where it is more likely there will be a census undercount. An “undercount” tends to marginalize low-wealth and people of color communities, which tends to deny these communities fair representation in districts created through redistricting and a reduced voice in policy formation and implementation at all levels of government. The undercount also results in less federal grant funds allocated for the city, county and state. The map also shows how many millions of dollars in federal grants each county received in 2008. |
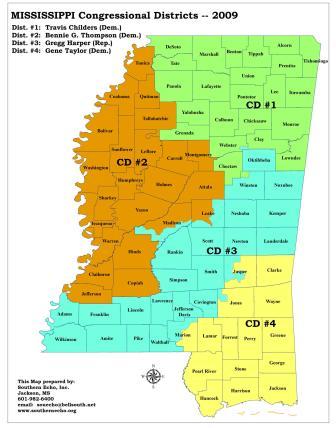 | MS Congressional Districts 2009 This map shows the four MS Congressional Districts and list the representatives of each district as of August 2009. |
 | Biloxi-Gulfport, MS, Area Hard to Count Census Tracts This map of the Biloxi-Gulfport Area shows the hard to count locations where it is more likely there will be a census undercount. An “undercount” means less federal grant funds for the county. The map also shows how many millions of dollars in federal grants the county received in 2007. |
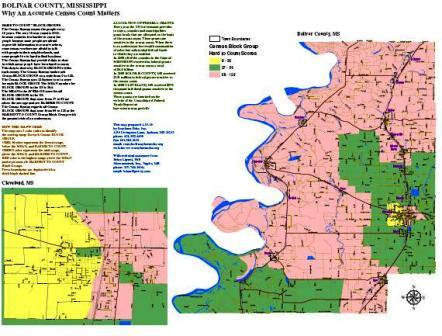 | Bolivar County, MS Hard to Count Block Groups This Bolivar County map shows the hard to count locations where it is more likely there will be a census undercount. An “undercount” means less federal grant funds for the county. The map also shows how many millions of dollars in federal grants the county received in 2008. |
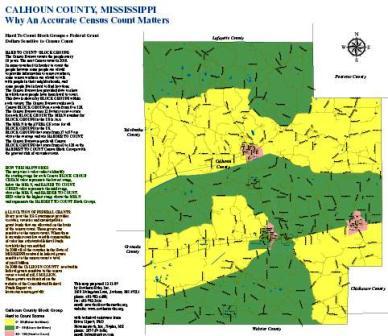 | Calhoun County, MS Hard to Count Block Groups This map uses Census Bureau data at the Block Group level to show the “hard to count” areas in Calhoun County, MS. Hard to count areas are where it is more likely that there will be a census undercount in 2010. An “undercount” means less federal grant funds for the cities and counties, as well as the state. A census undercount can undermine the creation of fair political districts. It can also result in the allocation of fewer seats in the US Congress than the state would have if there is a full and accurate count of all persons. |
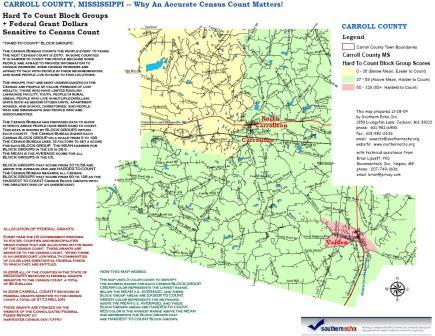 | Carroll County, MS Hard to Count Block Groups This Carroll County map shows the hard to count locations where it is more likely there will be a census undercount. An “undercount” means less federal grant funds for the county. The map also shows how many millions of dollars in federal grants the county received in 2008. |
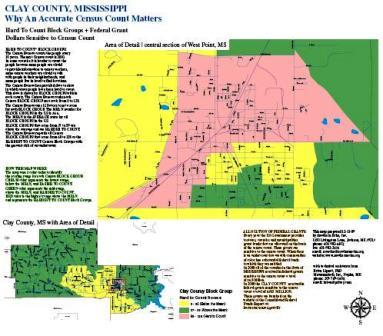 | Clay County, MS Hard to Count Block Groups This map uses Census Bureau data at the Block Group level to show the “hard to count” areas in Clay County, MS. Hard to count areas are where it is more likely that there will be a census undercount in 2010. An “undercount” means less federal grant funds for the cities and counties, as well as the state. A census undercount can undermine the creation of fair political districts. It can also result in the allocation of fewer seats in the US Congress than the state would have if there is a full and accurate count of all persons. |
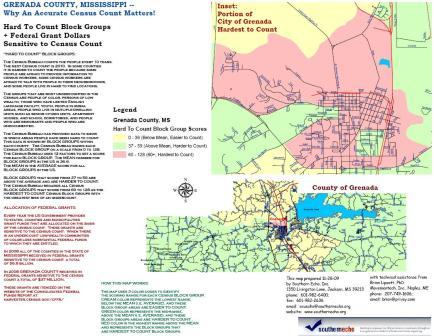 | Grenada County, MS Hard to Count Block Groups This Grenada County map shows the hard to count locations where it is more likely there will be a census undercount. An “undercount” means less federal grant funds for the county. The map also shows how many millions of dollars in federal grants the county received in 2008. |
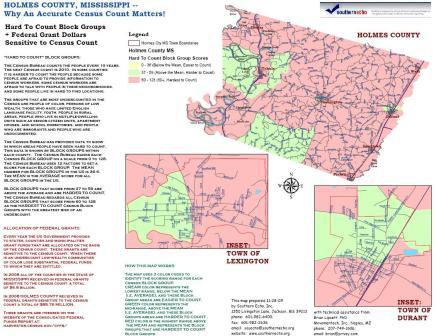 | Click here for a selection of census maps related to Holmes County, MS. |
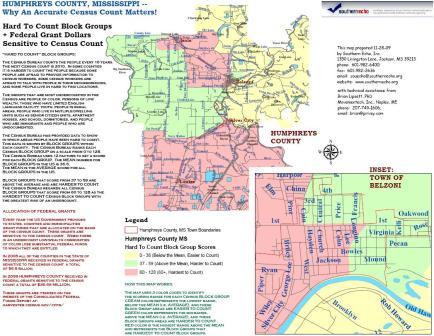 | Humphreys County, MS Hard to Count Block Groups This Humphreys County map shows the hard to count locations where it is more likely there will be a census undercount. An “undercount” means less federal grant funds for the county. The map also shows how many millions of dollars in federal grants the county received in 2008. |
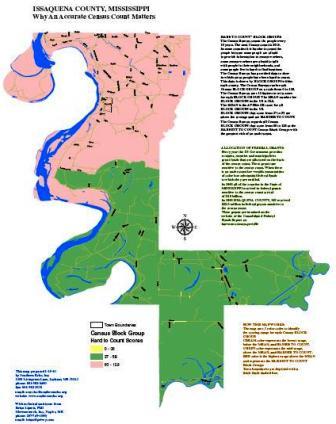 | Issaquena County, MS Hard to Count Block Groups This Issaquena County map shows the hard to count locations where it is more likely there will be a census undercount. An “undercount” means less federal grant funds for the county. The map also shows how many millions of dollars in federal grants the county received in 2008. |
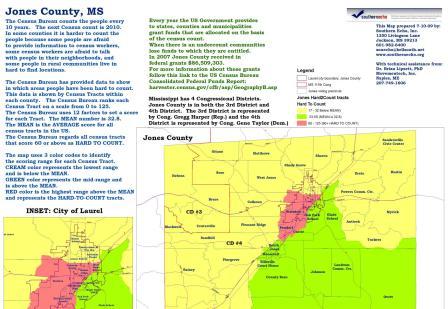 | Jones County, MS Hard to Count Census Tracts This Jones County map shows the hard to count locations where it is more likely there will be a census undercount. An “undercount” means less federal grant funds for the county. The map also shows how many millions of dollars in federal grants the county received in 2007. |
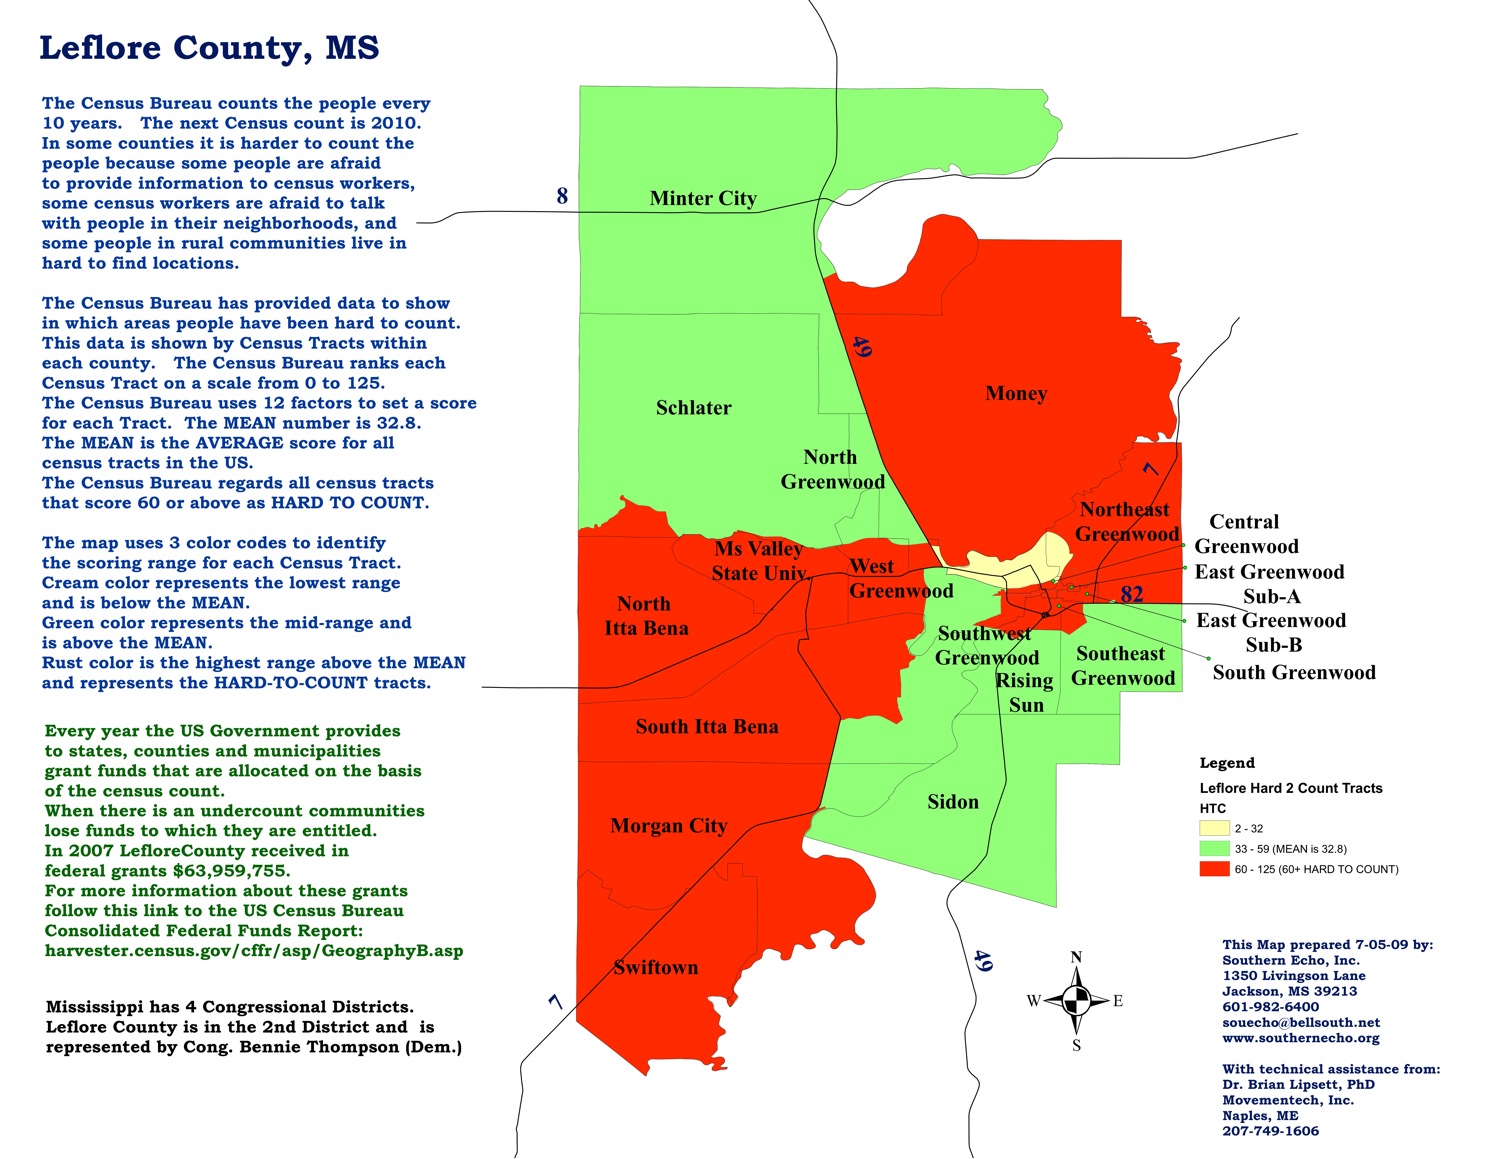
| Leflore County, MS Hard to Count Census Tracts This Leflore County, MS, map shows the hard to count locations where it is more likely there will be a census undercount. An “undercount” means less federal grant funds for the county. The map also shows how many millions of dollars in federal grants the county received in 2007. |
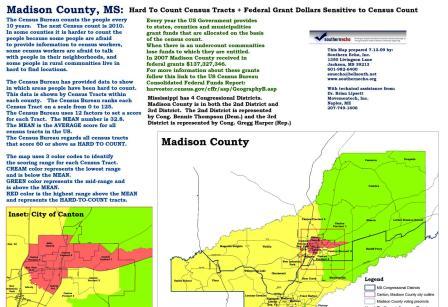 | Madison County, MS Hard to Count Census Tracts This Madison County map shows the hard to count locations where it is more likely there will be a census undercount. An “undercount” means less federal grant funds for the county. The map also shows how many millions of dollars in federal grants the county received in 2007. |
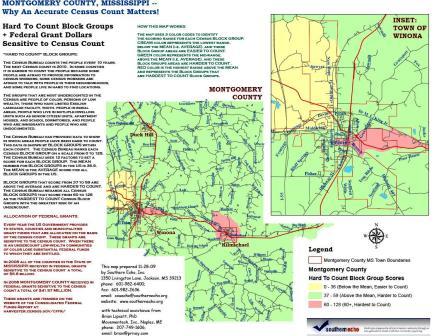 | Montgomery County, MS Hard to Count Block Groups This Montgomery County map shows the hard to count locations where it is more likely there will be a census undercount. An “undercount” means less federal grant funds for the county. The map also shows how many millions of dollars in federal grants the county received in 2008. |
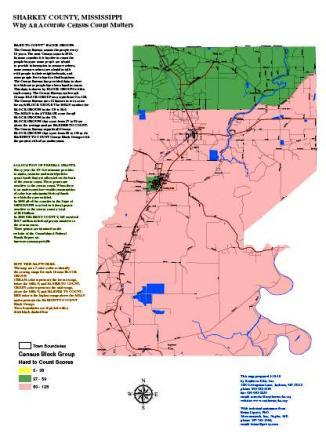 | Sharkey County, MS Hard to Count Block Groups This Sharkey County map shows the hard to count locations where it is more likely there will be a census undercount. An “undercount” means less federal grant funds for the county. The map also shows how many millions of dollars in federal grants the county received in 2008. |
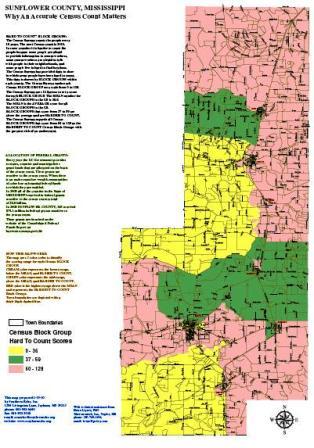 | Sunflower County, MS Census Maps Click here for a selection of census maps related to Sunflower County, MS. |
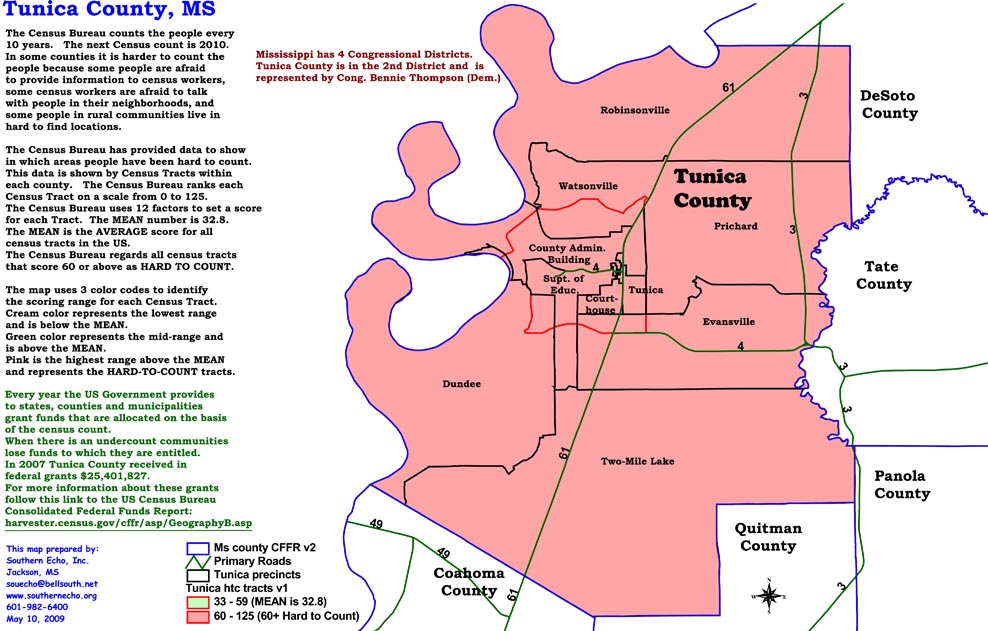 | Tunica County, MS Hard to Count Census Tracts This Tunica County map shows the hard to count locations where it is more likely there will be a census undercount. An “undercount” means less federal grant funds for the county. The map also shows how many millions of dollars in federal grants the county received in 2007. |
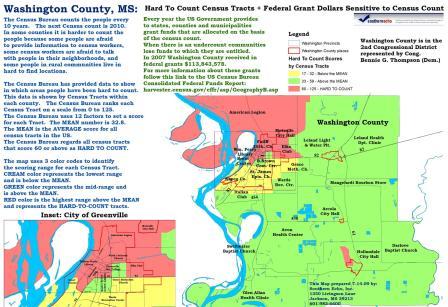 | Washington County, MS Census Maps Click here for a selection of census maps related to Washington County, MS. |
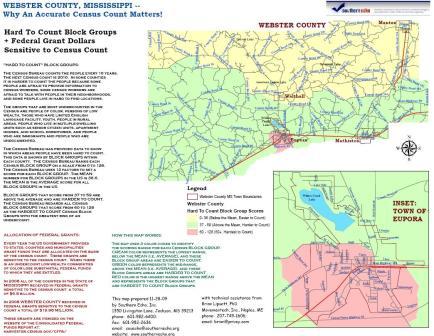 | Webster County, MS Hard to Count Block Groups This Webster County map shows the hard to count locations where it is more likely there will be a census undercount. An “undercount” means less federal grant funds for the county. The map also shows how many millions of dollars in federal grants the county received in 2008. |