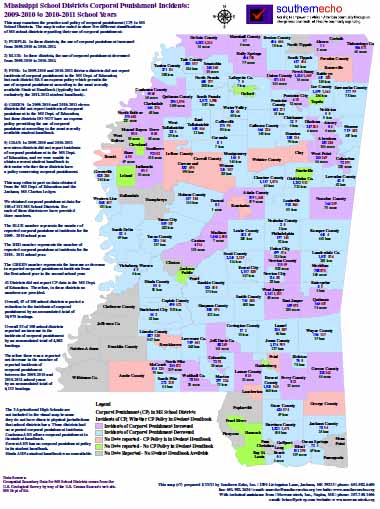
Southern Echo released a color coded map illustrating the changes by school district from the 2009-2010 school year to the 2010-2011 school year in the use of corporal punishment – i.e. the number of occasions on which teachers or administrators beat students with a hard instrument.
For each district that provided data to the MS Dept. of Education we have color-coded the data for 09-10 and 10-11 on the map. We have ordering ambie also shown on the map the difference in the number of student beatings from 09-10 to 10-11. Overall 67 districts reported a decrease in the number of student beatings from 09-10 to 10-11. Overall 33 districts reported an increase in the number of student beatings from 09-10 to 10-11.